This week’s “trade of the week” is one that I initiated on 24 October last year when Thomas Cook broke upwards from its “flat-line”. In the following chart, the lower horizontal line shows the entry price and the higher horizontal line shows the profit I am guaranteed to take (at least) thanks to a guaranteed stop order that I have trailed upwards during the life of this position trade.
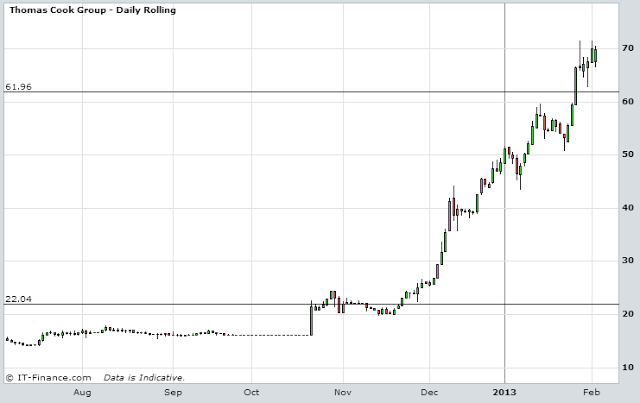
I had to draw those annotations manually, because this Cantor Index chart doesn’t superimpose currently “in play” trades onto charts in the way that IG and ETX Capital charts do. This means I could have fooled you, and simply made up the entry and stop order levels retrospectively, so here’s the proof that it’s a real-life still-in-play (so it could go even higher) position trade:

As with all my “demo” trades it’s not big money, but it is profit and you can scale up to your own tastes. If you’d like to find and execute trading opportunities like this one, you might find the clues in my Position Trading and Better Spread Betting books.
Two Steps to Better Spread Betting:
1) Buy the Better Spread Betting Book
2) Sign up with Capital Spreads, IG, ETX Capital, or Spread Co
Disclaimer: this posting is for general education only; it is not trading advice.